When Google first spun up its servers back in 1998, few could have predicted the sheer scale of the infrastructure it would become. Fast forward to 2026, and it’s still the undisputed heavyweight of the search industry, commanding a staggering 89.82% of the global market share.
To put that dominance into perspective, we are looking at an ecosystem that processes over 5 trillion searches globally—that’s roughly 16.4 billion queries pinging the servers every single day.
The user base has exploded to over 5.06 billion people, marking a massive 679% growth from the 630 million users online back in 2006.
But the raw traffic data only tells half the story. The architecture of how we discover information has fundamentally shifted. With the heavy integration of AI Overviews and AI Mode directly into the SERPs, Google has completely rewritten the traditional search playbook.
We’re no longer just looking at basic keyword matching; the modern results page is a highly dynamic environment driven almost entirely by semantic entities and deep user intent.
Let’s break down exactly how Google’s algorithmic landscape has evolved over the decades and more importantly, map out where this AI-driven search architecture is heading next.
Google Search Users Over Time
Google Search continues to expand its global reach year after year. In 2026, the platform reached 5.06 billion users worldwide, increasing from 4.89 billion in 2025. Since the beginning of the decade, Google’s search user base has grown by 29.74%, reflecting its position as the world’s most widely used search engine.
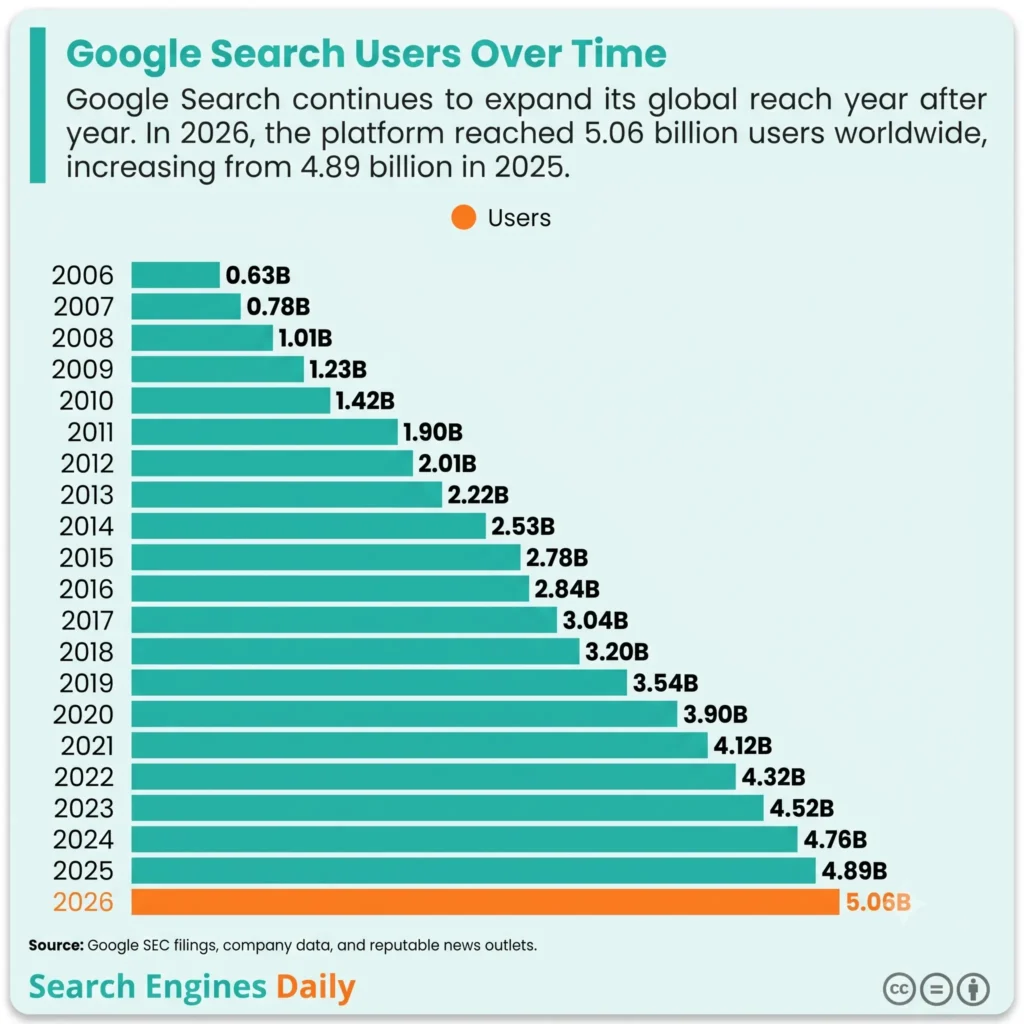
The table below highlights Google’s search user growth over time.
| Year | Users |
|---|---|
| 2006 | 0.63 billion |
| 2007 | 0.78 billion |
| 2008 | 1.01 billion |
| 2009 | 1.23 billion |
| 2010 | 1.42 billion |
| 2011 | 1.90 billion |
| 2012 | 2.01 billion |
| 2013 | 2.22 billion |
| 2014 | 2.53 billion |
| 2015 | 2.78 billion |
| 2016 | 2.84 billion |
| 2017 | 3.04 billion |
| 2018 | 3.20 billion |
| 2019 | 3.54 billion |
| 2020 | 3.90 billion |
| 2021 | 4.12 billion |
| 2022 | 4.32 billion |
| 2023 | 4.52 billion |
| 2024 | 4.76 billion |
| 2025 | 4.89 billion |
| 2026 | 5.06 billion |
Source: Google SEC filings, company data, and reputable news outlets.
Google Search Usage Growth Rate Over the Years
Google Search has experienced remarkable growth since its early days. In 2025, the platform processed more than 5 trillion searches worldwide, and estimates suggest that annual search volume will exceed 6 trillion searches in 2026. This steady increase has been fueled by wider internet adoption, growing smartphone penetration, and the evolution of AI-powered search experiences.
Over the past two decades, Google’s search volume has scaled at an extraordinary pace. Annual searches grew from 1 billion in 1999 to 14 billion in 2000, surpassed 365 billion by 2009, and reached approximately 1.2 trillion between 2012 and 2015. Since then, search activity has continued to accelerate, reaching new milestones every few years.
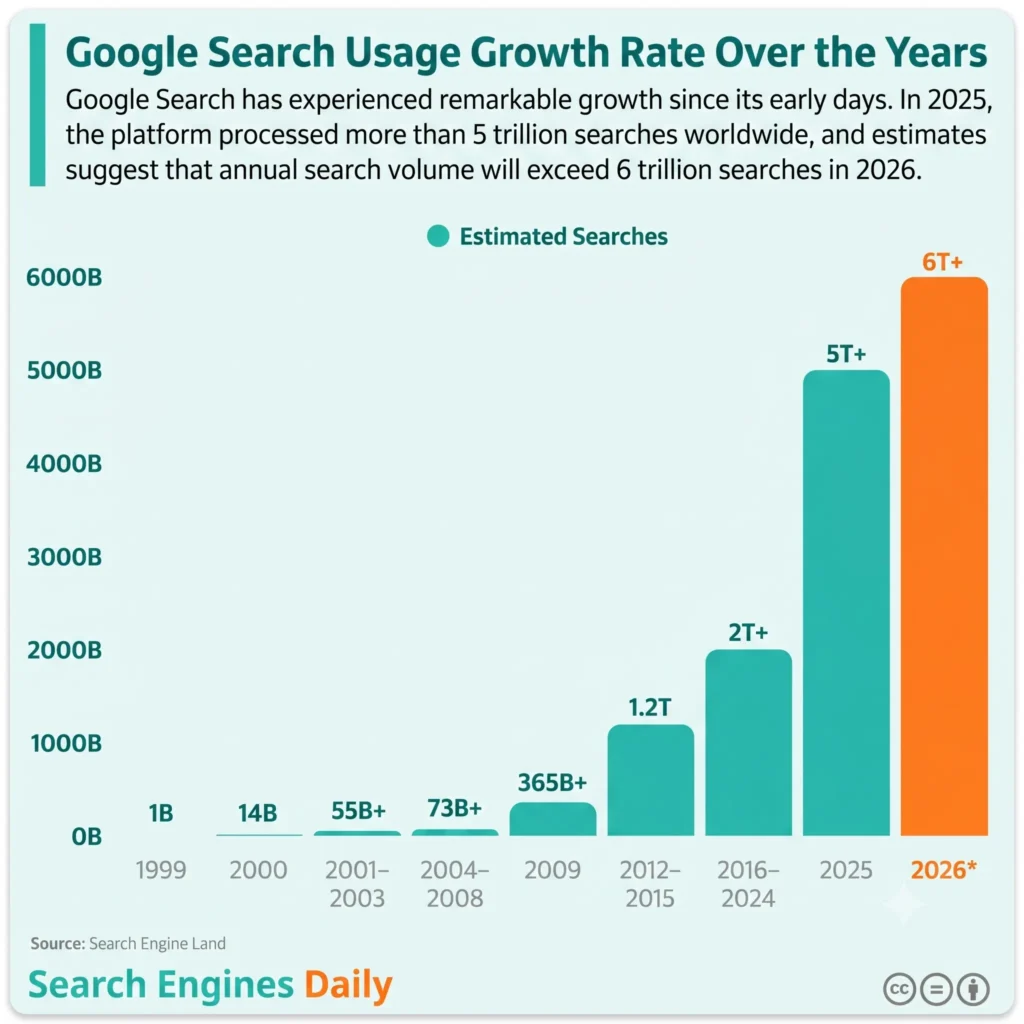
The table below outlines Google’s estimated search growth over time.
| Time Period | Estimated Searches |
|---|---|
| 1999 | 1 billion |
| 2000 | 14 billion |
| 2001 to 2003 | 55 billion+ |
| 2004 to 2008 | 73 billion |
| 2009 | 365 billion+ |
| 2012 to 2015 | 1.2 trillion |
| 2016 to 2024 | 2 trillion+ |
| 2025 | 5 trillion+ |
| 2026* | 6 trillion |
Source: Search Engine Land
Google Search Market Share Worldwide
Google continues to dominate the global search engine market. As of 2026, Google holds an 89.82% worldwide market share, maintaining its leadership despite increasing competition. Between 2020 and 2025, its market share consistently remained above 89%, reaching a peak of 92.58% in 2022.
While Google’s market share has experienced minor fluctuations over the years, the overall change has been modest, with an average annual growth rate of -0.29% between 2020 and 2026. Even with these slight declines, Google remains the world’s most widely used search engine by a significant margin.
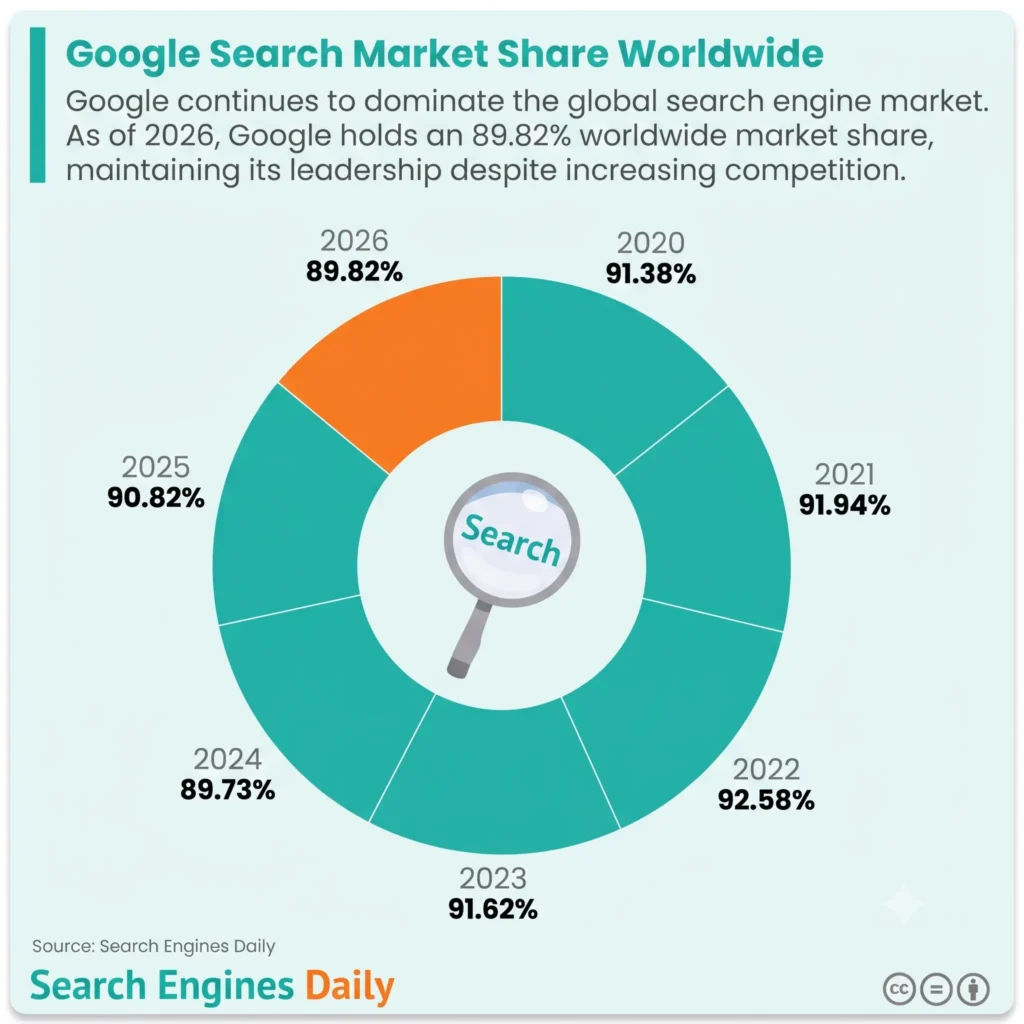
The table below provides a year-by-year overview of Google’s global search market share.
| Time Period | Google Search Market Share (Worldwide) |
|---|---|
| 2020 | 91.38% |
| 2021 | 91.94% |
| 2022 | 92.58% |
| 2023 | 91.62% |
| 2024 | 89.73% |
| 2025 | 90.82% |
| 2026 | 89.82% |
Google Search Market Share in Different Countries
Google’s search market share varies significantly across countries, reflecting differences in local search preferences and regional competition. In 2026, Israel leads with a 98.30% market share, followed closely by India at 97.38%. Other markets where Google maintains overwhelming dominance include the United Kingdom (91.95%), Brazil (91.14%), New Zealand (91.04%), and Australia (90.70%).
Across North America, Google continues to command a strong position with an 83.86% market share in the United States and 86.70% in Canada. However, its presence is considerably lower in markets where local search engines remain popular, including Japan (64.45%), South Korea (42.75%), Russia (27.43%), and China (1.92%).
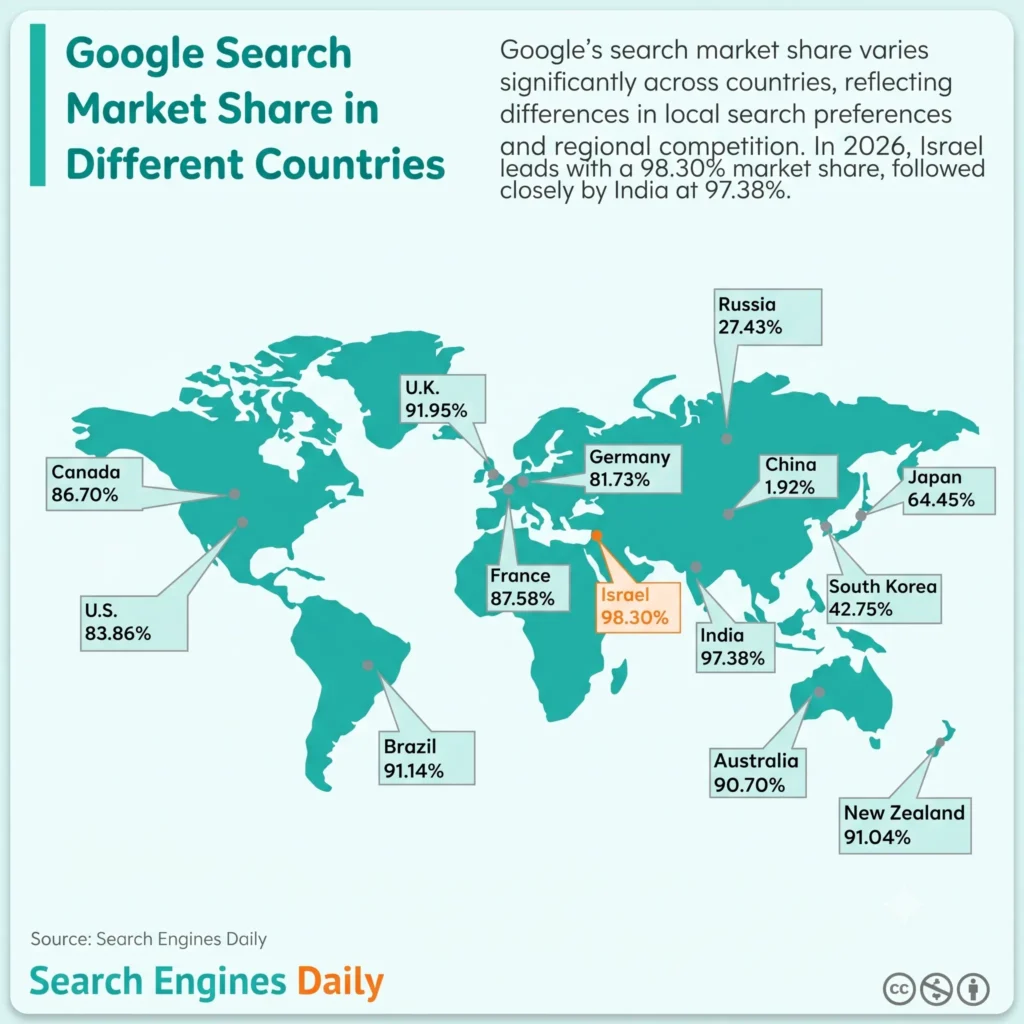
The table below provides a country-by-country breakdown of Google’s search market share in 2026.
| Country | Google Search Market Share (2026) |
|---|---|
| Israel | 98.30% |
| India | 97.38% |
| United Kingdom | 91.95% |
| Brazil | 91.14% |
| New Zealand | 91.04% |
| Australia | 90.70% |
| France | 87.58% |
| Canada | 86.70% |
| United States | 83.86% |
| Germany | 81.73% |
| Japan | 64.45% |
| South Korea | 42.75% |
| Russia | 27.43% |
| China | 1.92% |
Google Search Market Share in the United States
Google remains the leading search engine in the United States, although its market share has gradually declined in recent years. In 2026, Google accounted for 83.86% of the US search market, down from the 87%–89% range it consistently maintained between 2020 and 2025. The company’s highest share during this period was 88.70% in 2022.
The decline in 2026 highlights a gradual shift in the US search landscape, driven by increasing competition and evolving search behavior. Despite this change, Google continues to dominate the market by a wide margin and remains the primary search platform for most American users.
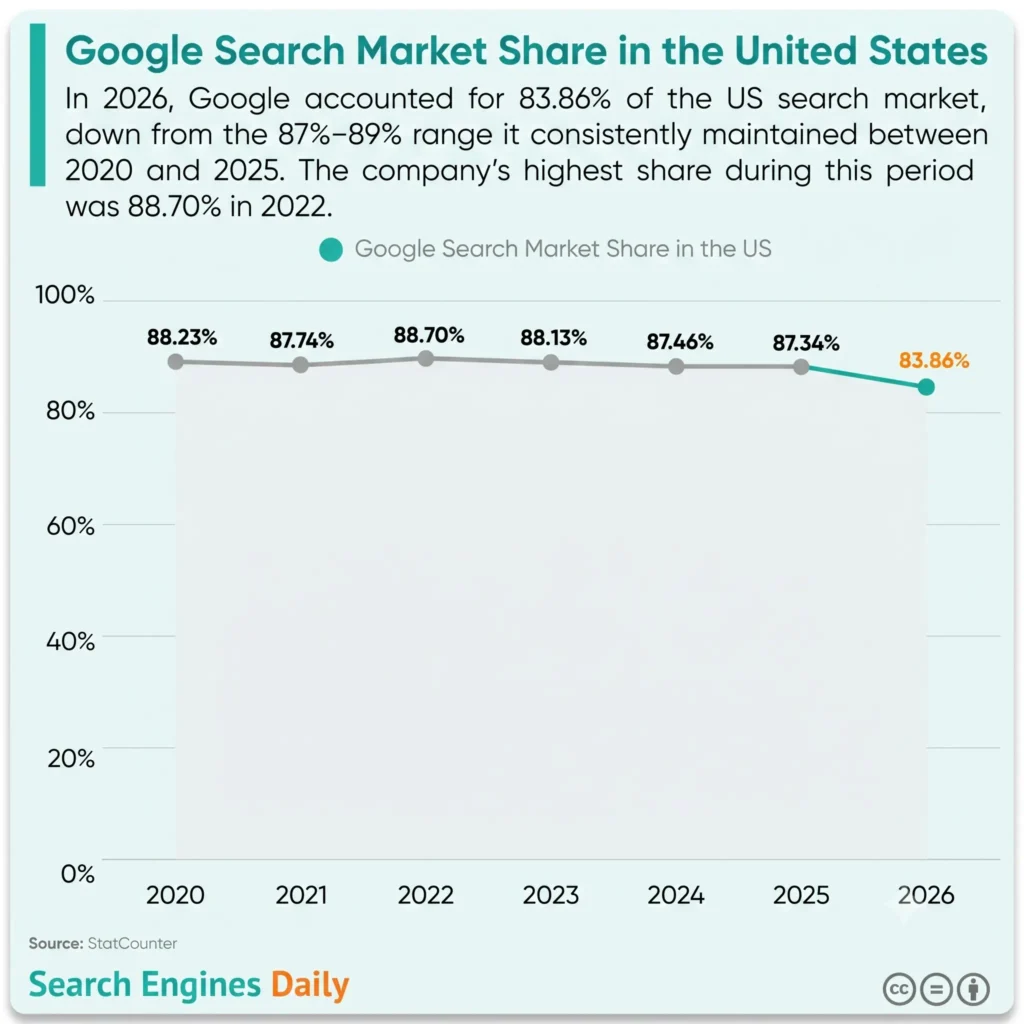
The table below shows Google’s search market share in the United States over the past several years.
| Year | Google Search Market Share in the US |
|---|---|
| 2020 | 88.23% |
| 2021 | 87.74% |
| 2022 | 88.70% |
| 2023 | 88.13% |
| 2024 | 87.46% |
| 2025 | 87.34% |
| 2026 | 83.86% |
Source: StatCounter
How Many Google Searches Per Day?
Google now processes search queries at an unprecedented scale. As of 2026, the search engine handles more than 5 trillion searches annually, averaging approximately 13.70 billion searches per day and 416.67 billion searches each month. On a daily basis, Google processes roughly 1,088% more searches than Bing, reinforcing its dominance in the global search market.
Google first confirmed in 2016 that it processed at least 2 trillion searches per year. Since then, annual search volume has increased by approximately 150%, driven by growing internet adoption, mobile usage, and AI-powered search experiences.
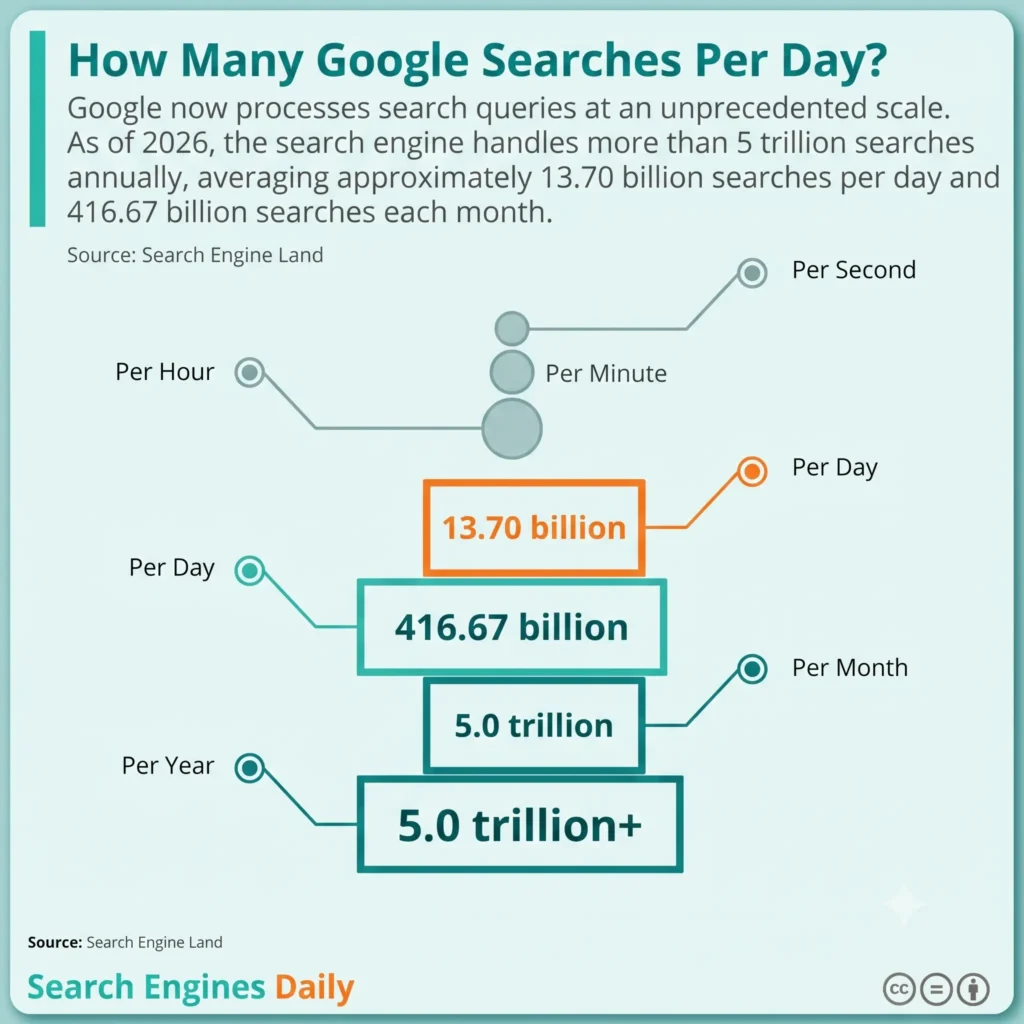
The table below breaks down Google’s estimated search volume across different time intervals.
| Time Frame | Estimated Google Searches |
|---|---|
| Per Year | 5 trillion |
| Per Month | 416.67 billion |
| Per Day | 13.70 billion |
| Per Hour | 570.78 million |
| Per Minute | 9.51 million |
In the United States, desktop users perform an average of 126 unique Google searches per month, or roughly 4.2 searches per person per day. Search frequency varies by user, with 34% of Americans making more than 101 searches each month, 36% completing 21 to 100 searches, and the remaining 30% performing 1 to 20 searches monthly.

Google Search remains the primary way Americans discover information online. While the traditional search box accounts for the overwhelming majority of activity, users also rely on specialized Google search verticals such as Images, Video, Maps, News, and Shopping.
| Google Search Vertical | Usage by Americans |
|---|---|
| Google Search | 86.94% |
| Images | 10.62% |
| Video | 1.16% |
| Maps | 0.64% |
| News | 0.38% |
| Shopping | 0.23% |
| Web | 0.04% |
Source: Search Engine Land
Desktop vs. Mobile Google Search Statistics
Mobile devices continue to shape how people use Google Search. With more than 4 billion smartphone users worldwide, nearly 95% rely on Google as their primary search engine. On desktop, Google also maintains a commanding lead, with 82.79% of users choosing it as their default search platform.
Search behavior has become increasingly mobile-first, especially in the United States, where 63% of Google searches now originate from mobile devices. Mobile queries also tend to be concise, with almost 40% consisting of three to four words, reflecting users’ preference for short, intent-driven searches.
Sources: StatCounter, MageCamp
Most Searched Keywords on Google Worldwide
Search demand on Google is largely driven by popular digital platforms, AI tools, and everyday online services. As of 2026, “ChatGPT” ranks as the most searched keyword worldwide, generating 768.3 million monthly searches. It is followed by “WhatsApp Web” with 533.4 million monthly searches and “YouTube” with 390.8 million.
Other high-volume queries include “Chat GPT”, “Translate”, “Facebook”, “Amazon”, “Google”, “Gmail”, and “Canva”, highlighting the continued popularity of communication platforms, productivity tools, and major online brands.
The table below lists the most searched keywords on Google globally.
| Keyword | Monthly Search Volume |
|---|---|
| ChatGPT | 768.3 million |
| WhatsApp Web | 533.4 million |
| YouTube | 390.8 million |
| Chat GPT | 277.6 million |
| Translate | 254.3 million |
| 207.2 million | |
| Amazon | 204.1 million |
| 192.3 million | |
| Gmail | 189.8 million |
| Canva | 185.0 million |
Most Searched Keywords on Google in the United States
Search trends in the United States differ slightly from the global picture. “YouTube” ranks as the most searched keyword, generating 88.3 million monthly searches. It is followed closely by “ChatGPT” with 81.34 million searches and “Amazon” with 81.17 million.
Interestingly, “Google” is also among its own most searched terms, ranking fourth with 73.23 million monthly searches. Other frequently searched keywords include Gmail, Facebook, Wordle, Google Translate, Translate, and Chat GPT.

The table below highlights the most searched keywords on Google in the United States.
| Keyword | Monthly Search Volume |
|---|---|
| YouTube | 88.3 million |
| ChatGPT | 81.34 million |
| Amazon | 81.17 million |
| 73.23 million | |
| Gmail | 58.12 million |
| 49.09 million | |
| Wordle | 40.37 million |
| Google Translate | 31.60 million |
| Translate | 30.26 million |
| Chat GPT | 29.04 million |
Source: Ahrefs
Google Lens Search Statistics
Google Lens has rapidly become one of the largest visual search platforms in the world. As of 2026, users perform 12 billion visual searches every month, representing a 4× increase in just two years. An increasing share of these searches is now multimodal, combining images with text to deliver more precise and context-aware results.
Google Lens also rewards strong on-page optimization. Around 32.5% of Lens results come from pages whose title tags contain keywords matching the visual search query, suggesting that traditional SEO signals still play an important role in visual discovery.
Image placement also matters. Nearly one-third of Google Lens results originate from images positioned within the top 25% of a webpage, indicating that prominently placed visuals have a greater chance of appearing in Lens search results.
Among external websites, Pinterest contributes approximately 7.2% of Google Lens image results, while Amazon accounts for 4.1%, making them two of the most visible domains in Google’s visual search ecosystem.
Source: Backlinko
Voice Search Statistics on Google
Voice search continues to reshape how users interact with Google, particularly on mobile devices. Today, 27% of mobile Google searches are performed using voice, reflecting the growing preference for hands-free and conversational search experiences.
Generation Z leads voice assistant adoption, with 55.2% using voice assistants every month. Local search also plays a major role, as 76% of voice searches containing “near me” are related to finding nearby businesses. Overall, more than 60% of local searches are conducted through voice, highlighting its importance for local SEO.
Google Assistant alone processes more than 1 billion voice searches every month, demonstrating the continued growth of voice-enabled search across the Google ecosystem.
Sources: Think with Google, Imarticus, Search Engine Land, Bitbinders
AI-Focused Google Search Statistics
Artificial intelligence has become a core part of the Google Search experience. In 2026, AI Overviews appear in more than 55% of Google search results worldwide and in around 60% of searches in the United States.
User adoption continues to grow alongside this rollout. Approximately 58% of US adults report seeing at least one AI-generated summary while searching on Google, making AI-powered answers an increasingly common part of the search journey.
The sources cited in AI Overviews closely mirror those found in traditional search results. Wikipedia, YouTube, and Reddit remain the most frequently referenced platforms, accounting for roughly 15% of links in AI summaries and 17% of links in standard organic results.
Most AI Overviews include 8 to 11 citations, with 9 sources being the most common configuration. These summaries also favor concise responses, as one-third fall between 150 and 200 words, reflecting Google’s emphasis on delivering fast, digestible answers that satisfy search intent.
Sources: Ahrefs, Pew Research Center
Consumer Behavior Google Search Statistics
Google Search continues to reflect how people discover information, evaluate options, and navigate the web. Search data shows that 60.5% of Millennials primarily use search engines to learn, research, and find detailed information, reinforcing Google’s role as one of the world’s leading sources of knowledge.
Commercial intent is also becoming more prominent. Transactional searches now account for 26.4% of all queries, up from 24.7% a year earlier, indicating that more users are searching with the intention to make a purchase or complete a specific action.
Search behavior is also becoming more repetitive. Repeat searches have increased by 5.1%, largely because users return to familiar topics, trusted websites, and previously visited pages instead of starting every search from scratch.
At the same time, navigational searches represented approximately 13.1% of all Google searches in early 2026. These queries are designed to reach a specific destination, with users searching directly for brands or websites such as Facebook or YouTube rather than exploring broader informational topics.
Sources: ScienceDirect, SEOptimer